Our first report on the FIFA business dealt with FIFA’s revenues and highlighted
their impressive rise and progressive diversification. In parallel to this
growth of FIFA’s income, it is quite natural that its expenses have been
following a similar path (see Graph 1). However, as we will see FIFA makes it
sometimes very difficult to identify precisely where the money is going. Nonetheless,
this is precisely what we wish to tackle in this post, and to do so we
will rely on the FIFA Financial reports over the last 10 years.
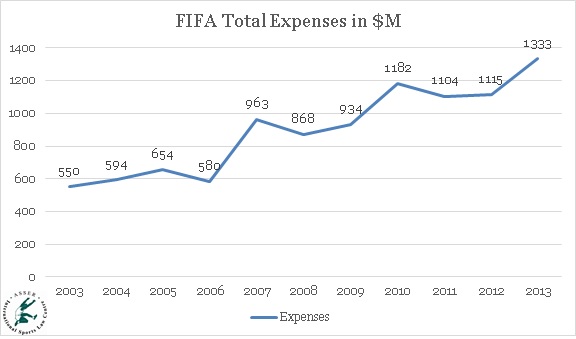
Graph 1: FIFA Expenses in USD million (adjusted for inflation),
2003-2013.
The question of the final destination of FIFA’s money is a contentious
one. Many allege that FIFA executives may be profiting directly or indirectly
from the revenues amassed. In order to better understand to what end
FIFA’s money is disbursed, we have gathered the data contained in FIFA’s
Financial Reports over a 10 year time frame and we have adjusted the numbers
for inflation, thus easing any comparison. This data is synthetized in Graphs 2
and 3.
Graph 2 provides a comparative overview of the evolution of the expenses
of FIFA in absolute numbers. This shows that event-related and personnel
expenses (to a lesser extent also other operating costs) have been rising,
while FIFA’s expenses on development and committees and congresses have
remained more or less stable. Graph 3 confirms that the evolution of FIFA’s
expenses is not linear, but general lessons can be drawn. The event-related
expenses have been representing more than 50% of FIFA’s expenses for 4 years
out of the last 5 (2010 stands out as an outlier). The trend towards the
reduction of the share of FIFA’s development expenses is clearly observable
(from 25% of total expenses in 2003 to 15% in 2013). This trend was only
reversed in the particular context of the South-Africa World-Cup in 2010. Besides that, the share of expenses linked to
wages and personnel has remained fairly stable (from 7% in 2003 to 8% in 2013).
Finally, the share of the other operating costs is difficult to compare across
the years, as FIFA has changed its accountancy system. Nonetheless, one can
assume that from 2007 onwards, other operating expenses and Football governance
(Legal costs and Committees and Congress expenses) expenses should be read together to match the
previous understanding of the notion of operating expenses. Thus, read
together, operating expenses would have risen from a 16% share in 2003 to a 20%
one in 2013.
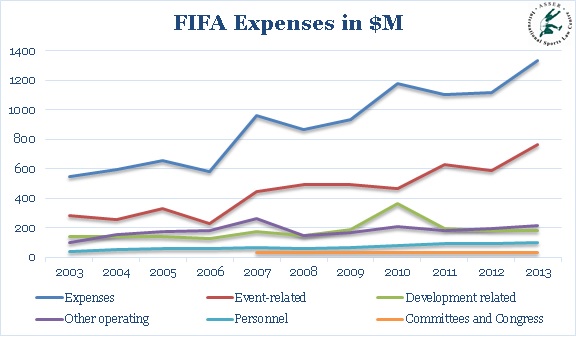
Graph 2: FIFA Expenses
(per stream) in USD million (adjusted for inflation) 2003-2013
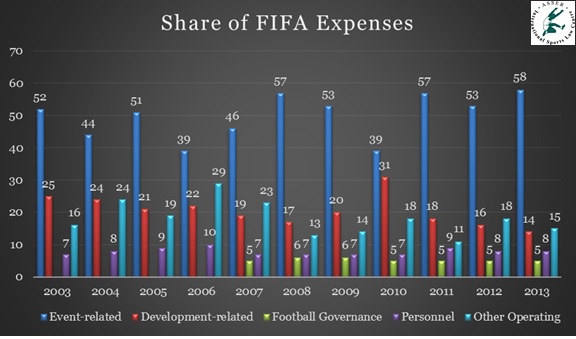
Graph 3: Share FIFA expenses over 2003-20013
FIFA’s expenses are concentrated on the organization of its events (see
Graph 4). In 2013, 58% of the expenses incurred by FIFA were event related
(Graph 3). Indeed, since 2003 FIFA’s expenses on its events have increased from
USD 286 million in 2003 to USD 728 million in 2013. However, it is very
difficult to extract from the reports provided by FIFA the precise objects of
these expenses. It should be noted that the organizing country is
tasked with the financing of the main infrastructural investments (stadium,
transportation etc…), leaving little infrastructural costs bearing on FIFA. The
event-related expenses can be traced back to the financing of the local FIFA
World Cup Organizing Committee (the Brazilian committee received up to USD
221.6 million), prize money, travel and accommodation costs of the FIFA
officials and the participating teams and other expenses. Furthermore, they
also include the FIFA Club Protection programme that compensates clubs in
case of injuries suffered by players while on duty with their national teams.
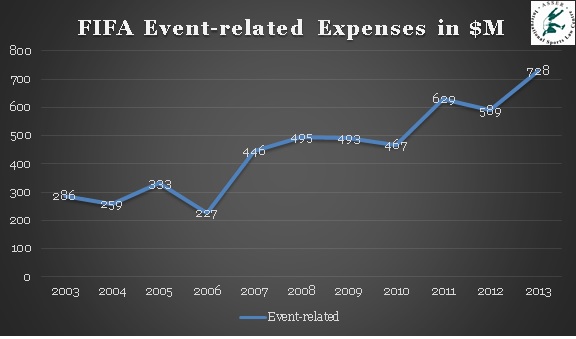
Graph 4: FIFA
Event-related Expenses in USD million (adjusted for inflation), 2003-2013
FIFA is often keen on trumpeting its development-related investments. It
is even a key argument to justify its public utility: FIFA is to favour the development of football worldwide. This myth falls partially apart when one
looks at the numbers and at their recent trajectory. Indeed, as shown in Graph
5, since 2003 (omitting the exceptional South-African peak of 2010) the
Development-related expenses of FIFA have remained fairly stable (139 USD
million in 2003, 185 USD million in 2013), in spite of the tremendous growth of
both its overall revenues and expenses. Thus highlighting that FIFA has not
been very keen on developing redistribution streams in favour of its members, the players or the supporters.
Furthermore, the development schemes of FIFA are notoriously lacking
transparency and their ability to achieve any real trickle-down effect is not
warranted. The recent corruption scandals surrounding former FIFA
vice-president Jack Warner, have highlighted the risks of this development aid
getting lost in the pockets of corrupted local football officials. If FIFA is serious
about football development, and not only interested in PR, it should overhaul
its development funding scheme, both in terms of absolute numbers and of its institutional
set-up.
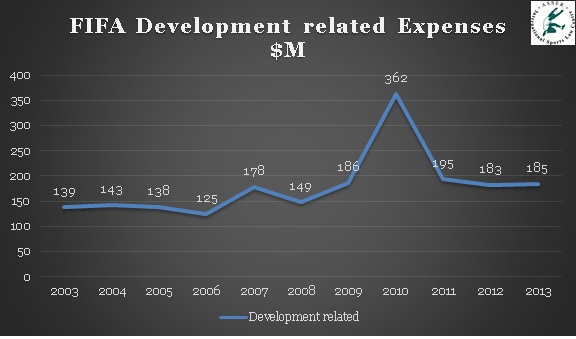
Graph 5: FIFA Development
related expenses in USD million (Adjusted to inflation) 2003-2013
On the other hand, FIFA’s own personnel costs have grown over the last
10 years (Graph 6) from 37 USD million in 2003, to 103 USD million in 2013.
FIFA employs 400 staff members at its administrative centre in Zurich. The
administration of FIFA is a costly enterprise. In 2013 the operating expenses
reached 219 USD million (Graph 8), this includes the personnel expenses (Graph
6), but not the football governance expenses (the Committees and Congress expenses
in Graph7 and legal expenses), overall the operating cost reaches 276 USD
million! Those costs, especially the one dubbed other operating costs (Graph8)
are relatively obscure. What do they include? Personnel (102 USD million in
2013), information technology, buildings and maintenance (22 USD million in
2013), taxes and duties (17 USD million in 2013), depreciation and amortization
(12 USD million in 2013), communications (31 USD million in 2013) and other non determined expenses (32 USD million in 2013); but without
providing any more details about the concrete content of those categories. This
lack of explanation can only play in the hand of those that dismiss FIFA
altogether as an organization interested solely in its own wealth and well-being. One is
left puzzled by the amount of the operating costs, which are neither disbursed
for the organization of specific events (those are the event-related expenses
in Graph 4), nor for the organization of important meetings (those are the Congress
and Committees expenses in Graph 7). It may be that the FIFA building’s toilet are
made of gold or that its canteen is a three-star Michelin restaurant, but if so
we would like to know.
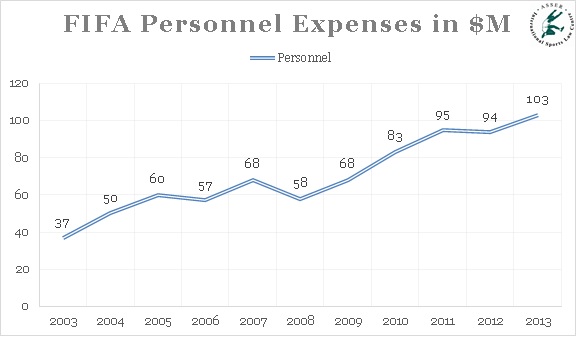
Graph 6: FIFA
Personnel Expenses in USD million (Adjusted to inflation) 2003-2013
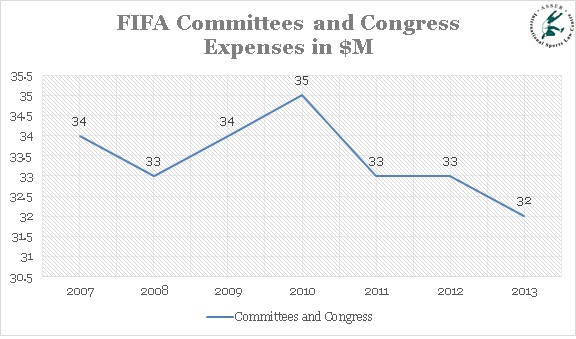
Graph 7: FIFA
Committees and Congress Expenses in USD million (Adjusted to Inflation)
2003-2013
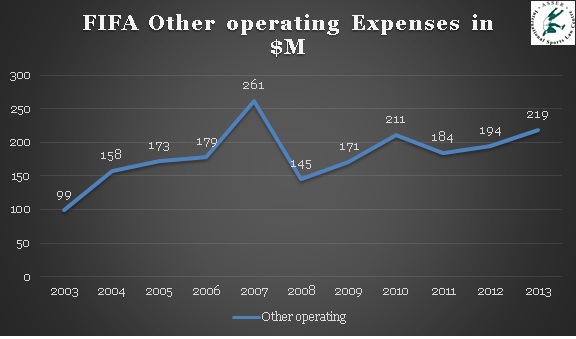
Graph 8: FIFA Other
Operating Expenses in USD million (Adjusted to inflation)
Finally, FIFA has constituted a richly dotted war chest. Over the last
10 years of economic success it has amassed huge financial reserves (Graph 9),
reaching up to 1453 USD million in 2013. Money lying still at a Swiss bank instead
of being invested in the development of football. This money is making money
for FIFA through the interests it produces. However, one can wonder why FIFA
would need to hold onto such a mountain of cash, instead of redistributing in
(in one way or another) to the ‘football family’. This perceived need is
illustrative of the transformation of FIFA into a proper business, far remote
from the interests of football and its actors.
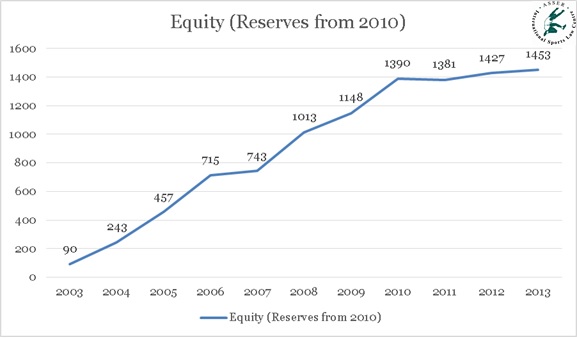
Graph 9: FIFA reserves
in USD million (Adjusted to inflation)
Conclusion: Follow the money…
We have tried to follow FIFA’s money, in order to better understand if
some of the criticisms raised against the management of FIFA were justified.
From a macro point of view one fact needs to be highlighted: FIFA has been
making a lot more money over the last 10 years and very few of this additional
money has been redistributed via its football development schemes. In fact, it
is the only stream of outgoings that has seen its share in FIFA’s overall
expenses drastically cut from 25% to 15% over the last 10 years. FIFA should
take its development programmes seriously if it is to continue relying on them
to argue its good faith and willingness to contribute to global welfare.
Moreover, one characteristics of FIFA’s financial report is the lack of
transparency and readability of the data. One is challenged to figure out what certain
categories concretely mean. FIFA is spending a lot for things that cannot be
traced easily. At a micro-level, there is an urgent need for external observers
to be able to go through the detailed account of FIFA. One of the trigger for
rumoured, but also probably for real, instances of corruption lies in the fact
that the supervisory mechanisms provided by public scrutiny (through the press
and other institutions) is rendered moot by the accounting walls built by FIFA
to isolate its spending from the public’s eye.
Eventually, FIFA must let us (and help us to) follow its money. This would
be a giant step towards countering the corruption allegations being made and
also legitimating the role of FIFA as the governing institution of world
football. If the ‘football family’ is able to see and control the path followed
by FIFA’s money, the trust in FIFA as an institution will most likely improve.